Gabriel Martinez a blog
El Paso Alcohol Sales with Chart.js
I’ve been wanting to use the Texas alcohol sales tax data in a project for a while now. You might have seen my other post using D3.js for data visualizations, and I thought I was going to use D3 for this project too.
I then found Chart.js; this library is small, powerful, and it’s fun to use.
See the app here.
It was very easy to get started. I got the data, and then started adapting it to work with Chart.js in my single-page application.
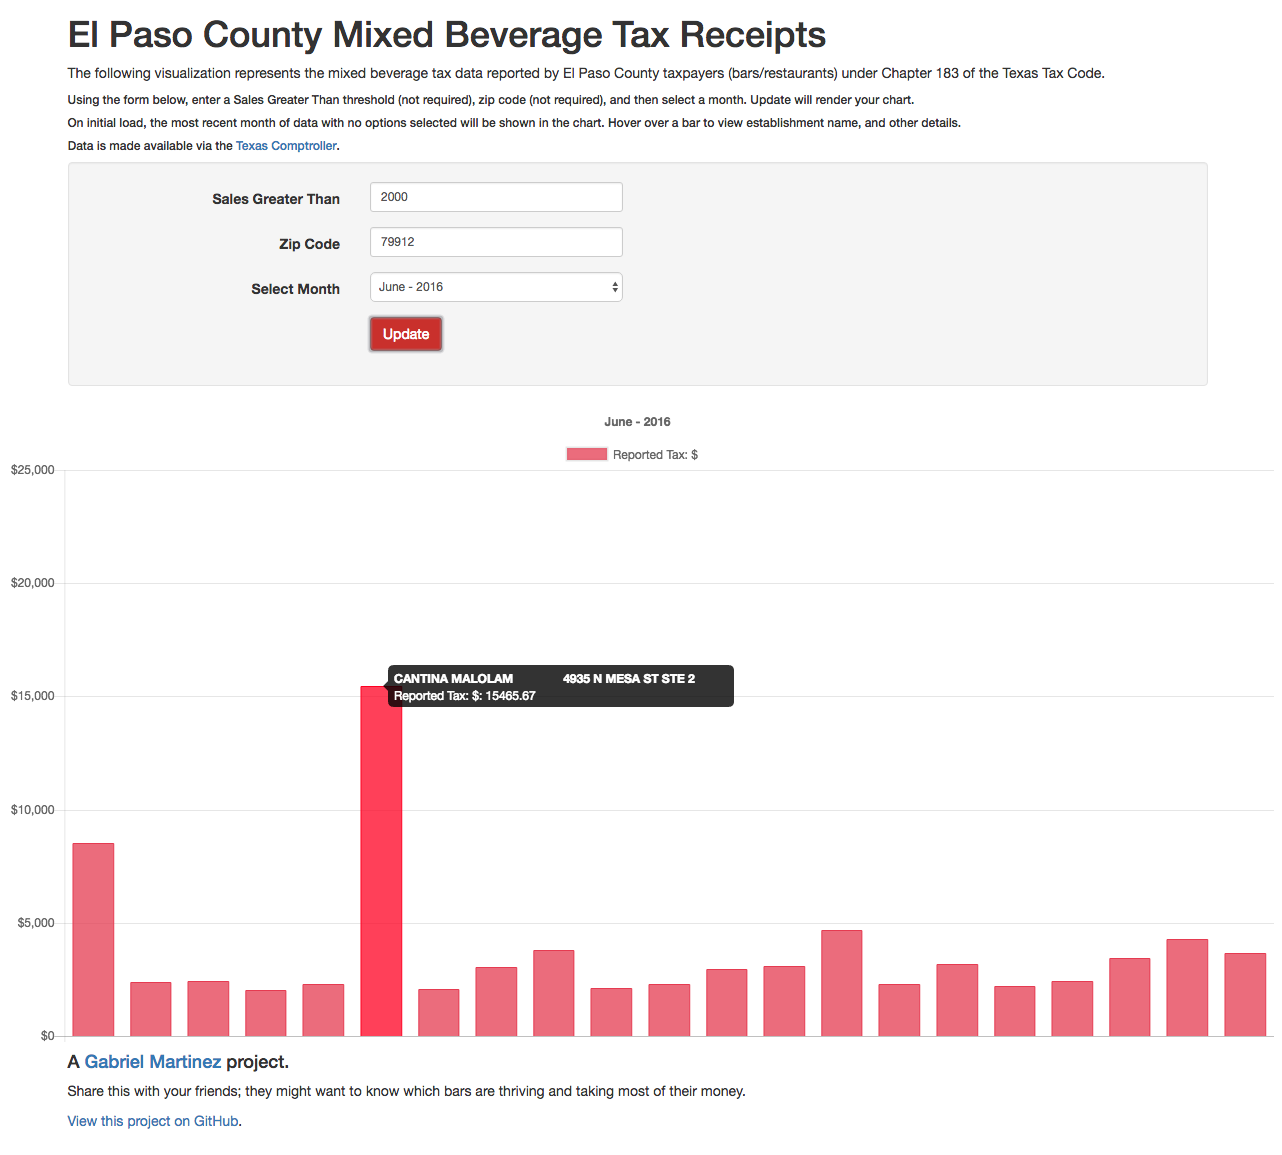
You can view the project here and start querying which bars/restaurants are doing the best in El Paso. I might add more options later, but for now you can view data based on zip code, sales greater than amount, and search the last seven months of data that the Texas Comptroller has made available.
Some of the options that I might add in are search by bar name, by entertainment district, and some other things that I have written down. The app looks best on a desktop and larger sized model iPads, and later I could make it easier to use on an iPhone/smaller width mobile device.
Summary of the application build process: I used npm (which comes with Node.js) to pull in module resources. During the development phase, I used browserify to package my JavaScript. The Texas Comptroller provides data as csv, but I used csvtojson to convert their data to json. I also used jQuery and Bootstrap.
See app screenshot below.